
Understanding Elliott Wave Theory
Learn the fundamentals of Elliott Wave Theory and how to apply it to predict market trends and enhance your trading strategies.


Elliott Wave Theory is a technical analysis approach used to forecast financial market trends by identifying repetitive patterns in price movements. Developed by Ralph Nelson Elliott in the 1930s, this theory posits that markets move in predictable cycles driven by investor psychology. This guide will cover the basics of Elliott Wave Theory, its key components, and practical applications in trading.
What is Elliott Wave Theory?
Elliott Wave Theory is based on the idea that market prices move in repetitive cycles driven by collective investor behavior. Elliott identified that these cycles consist of five waves in the direction of the trend followed by three corrective waves.
The Basic Wave Structure
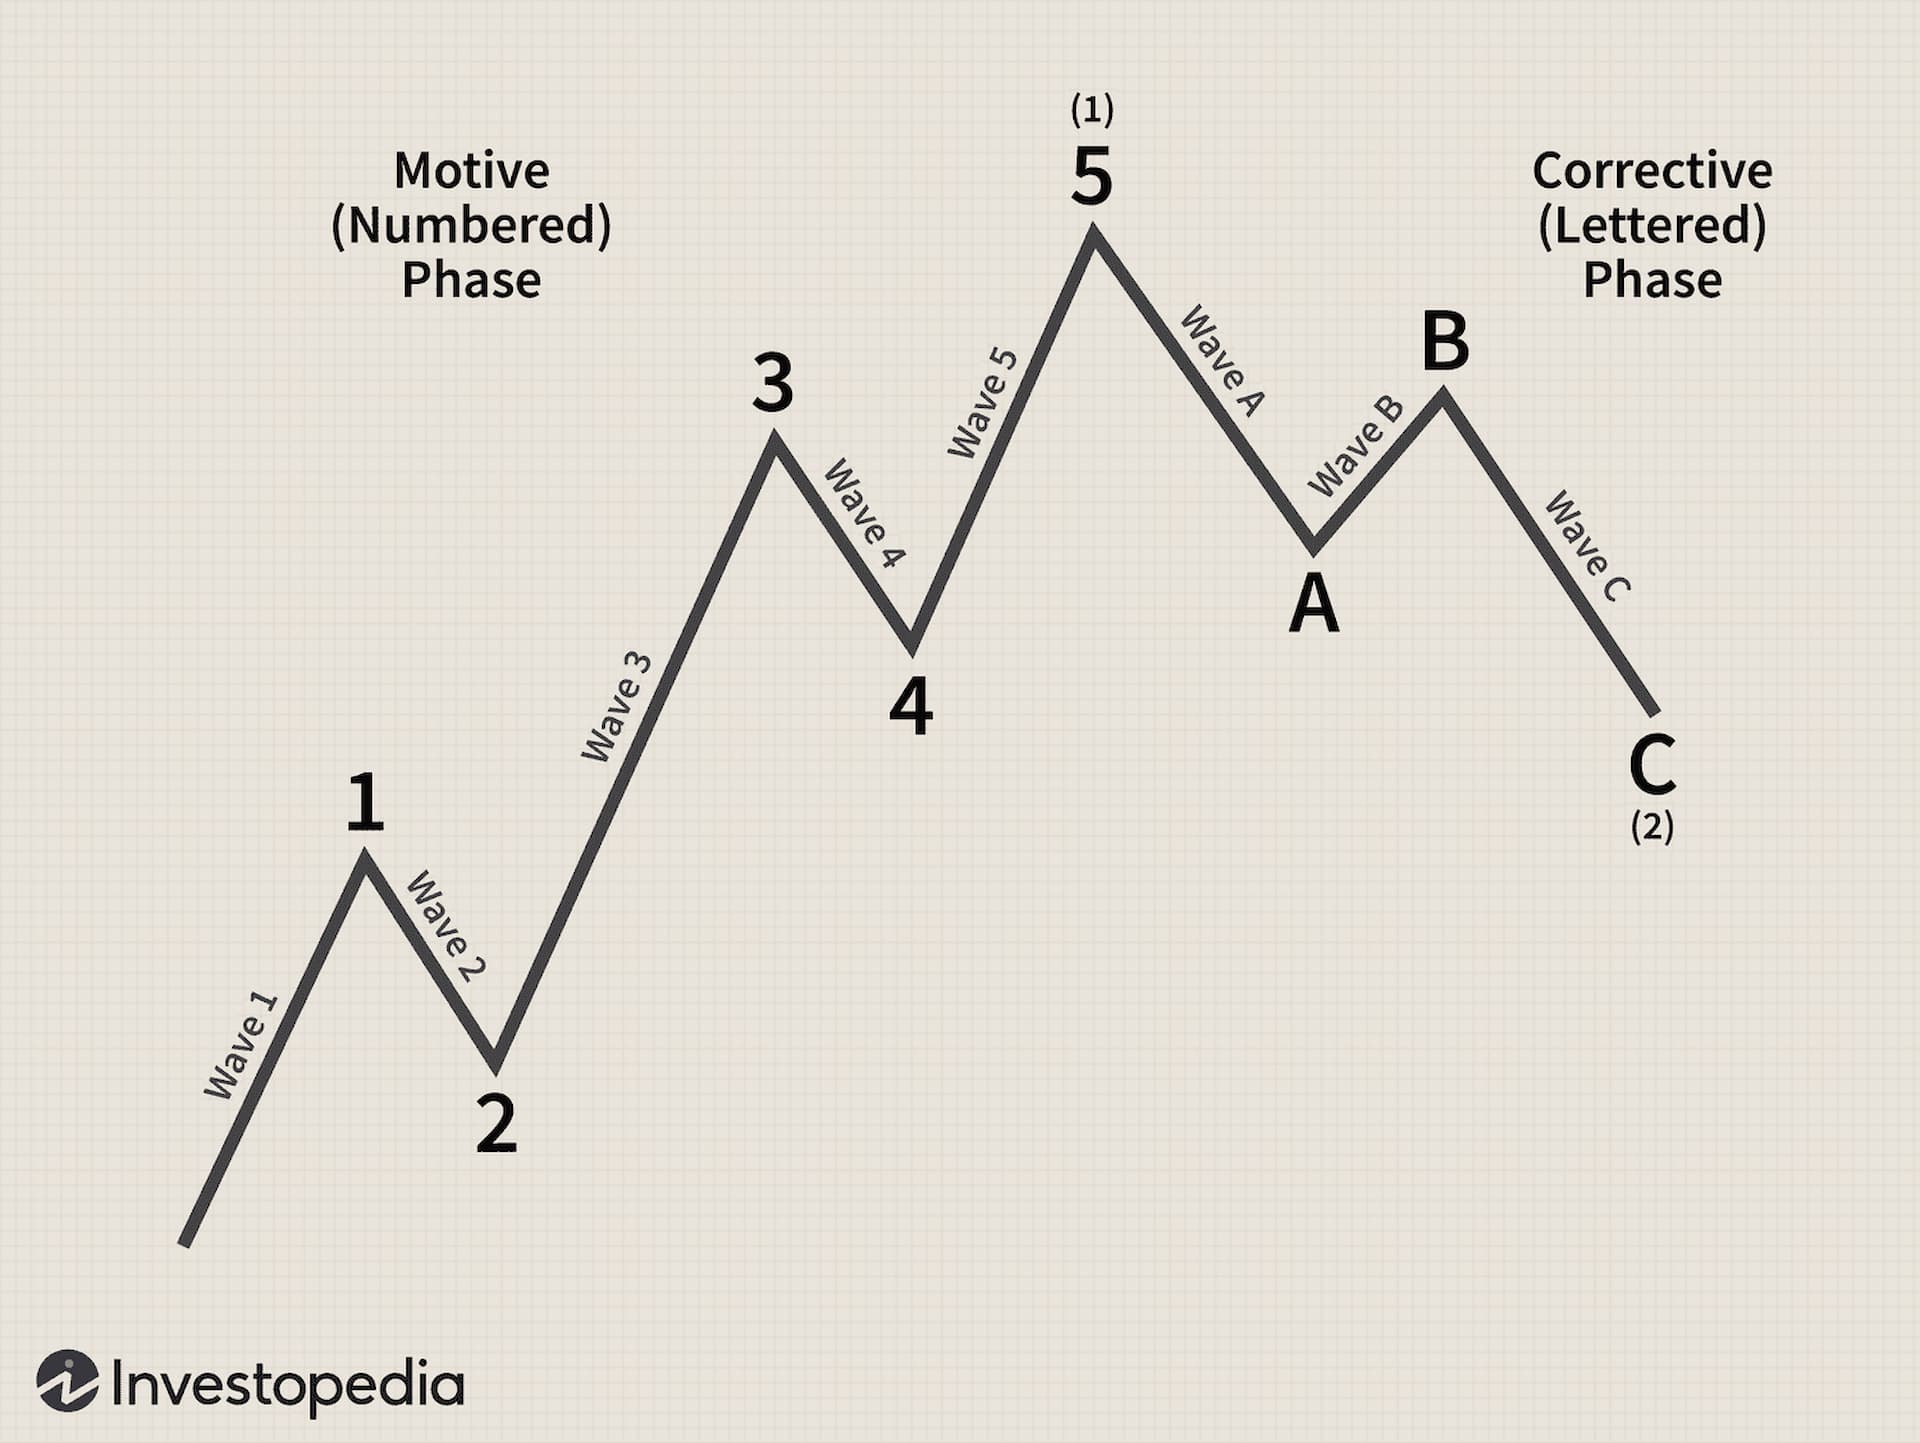
The Elliott Wave structure consists of two main phases:
-
Impulse Waves: These are the waves that move in the direction of the overall trend. An impulse wave consists of five sub-waves:
- Wave 1: The initial movement in the direction of the trend.
- Wave 2: A corrective wave that retraces part of Wave 1.
- Wave 3: The strongest and longest wave, continuing the trend.
- Wave 4: A corrective wave that retraces part of Wave 3.
- Wave 5: The final wave in the direction of the trend.
-
Corrective Waves: These waves move against the direction of the trend and consist of three sub-waves:
- Wave A: The initial move against the trend.
- Wave B: A partial retracement of Wave A.
- Wave C: The final wave in the corrective phase, often exceeding the end of Wave A.
Example: In a rising market, Wave 1 and Wave 3 are typically upward movements, while Wave 2 and Wave 4 are corrective downward movements. Wave 5 completes the bullish trend before the market enters a corrective phase.
Key Principles of Elliott Wave Theory
Wave Patterns
Elliott Wave Theory is built on several key principles and patterns:
- Five-Wave Pattern: The primary structure in an uptrend or downtrend consists of five waves in the direction of the trend (impulse waves) followed by a three-wave correction (corrective waves). For more on identifying trend patterns, visit forex trading or stock trading.
- Three-Wave Correction: After the five-wave impulse, the market typically undergoes a three-wave correction, which consists of waves A, B, and C.
- Wave Degrees: Elliott Waves exist at different degrees or time frames, from very short-term intraday waves to long-term multi-year cycles. For more information on different trading timeframes, explore trading tools.
Example: The stock market's long-term trends might follow a five-wave pattern, with intermediate corrections forming three-wave structures.
Fibonacci Relationships
Elliott Wave Theory often incorporates Fibonacci ratios to predict wave lengths and retracement levels. For instance:
- Wave 3: Often extends to 1.618 times the length of Wave 1.
- Wave 4: Typically retraces 23.6% to 38.2% of Wave 3.
Example: If Wave 1 is 10 points, Wave 3 might extend to approximately 16.18 points (10 * 1.618). Similarly, Wave 4 might retrace 23.6% of Wave 3. For more details on Fibonacci retracements, visit trading tools.
Practical Applications of Elliott Wave Theory
Identifying Market Trends
Traders use Elliott Wave Theory to identify the current market phase and anticipate future movements. By recognizing the wave structure, traders can predict potential trend reversals and entry points. To learn more about market trends and their analysis, check out forex trading and crypto resources.
Example: In a developing uptrend, identifying the end of Wave 4 and the beginning of Wave 5 can signal a potential buying opportunity.
Setting Targets and Stop Losses
Elliott Wave Theory helps traders set realistic targets and stop-loss levels based on wave relationships and Fibonacci extensions. For example, traders might place stop-loss orders below the end of Wave 4 to protect against adverse movements. To understand more about managing risks, refer to trading tools and indices.
Example: If the market is in Wave 5 of a bullish trend, traders might set a take-profit target based on Fibonacci extensions of Wave 5 and place stop-loss orders just below the end of Wave 4.
Combining with Other Indicators
For improved accuracy, Elliott Wave Theory is often combined with other technical indicators such as the Relative Strength Index (RSI) or Moving Averages. This multi-indicator approach confirms wave patterns and enhances trading decisions. To explore more indicators, visit forex trading and crypto.
Example: If Elliott Wave analysis suggests the end of Wave 5, confirming signals from the RSI or Moving Averages can provide additional confidence in the trade setup.
Common Mistakes in Elliott Wave Analysis
Overcomplicating Wave Counts
One common mistake is overcomplicating wave counts by identifying too many waves or misinterpreting wave structures. It’s crucial to simplify the analysis and focus on the primary trends and patterns.
Example: Misidentifying wave counts might lead to incorrect predictions of trend reversals or extensions, impacting trading decisions.
Ignoring Market Context
Elliott Wave Theory should be used within the broader market context. Ignoring macroeconomic factors or broader market trends can lead to misleading wave counts and inaccurate forecasts. For more on market context, explore forex trading and commodities.
Example: During major economic events or market crises, traditional Elliott Wave patterns might be disrupted, requiring traders to adjust their strategies accordingly.
Inaccurate Wave Count Analysis
Accurate wave count analysis is critical for effective use of Elliott Wave Theory. Incorrectly counting waves or failing to recognize the correct wave structure can result in flawed trading strategies.
Example: Miscounting waves can lead to incorrect predictions of wave completions or trend reversals, impacting the reliability of trade setups.
Conclusion
Elliott Wave Theory provides valuable insights into market cycles and price movements by identifying repetitive wave patterns. Understanding the basic wave structures, principles, and practical applications can enhance trading strategies and decision-making. Combining Elliott Wave analysis with other technical tools and considering market context will further improve trading accuracy and effectiveness. For additional resources on trading strategies and market analysis, visit trading tools, forex trading, and stock trading.
TAGS
Latest Education Articles
Show more


Take your trading to the next level.
Join the broker built for global success in just 3 easy steps. A seamless experience built for traders who value speed and simplicity.

Create Your Account

Make Your First deposit
