Using Fibonacci Retracements
Learn how to use Fibonacci retracements to identify potential support and resistance levels in trading.


Fibonacci Retracements are a crucial tool in technical analysis, used to identify potential support and resistance levels in financial markets. Based on mathematical relationships observed in nature, these retracement levels help traders predict potential price reversals. This detailed guide will cover how to use Fibonacci Retracements effectively, common mistakes to avoid, and how they integrate with other trading tools.
What are Fibonacci Retracements?
Fibonacci Retracements are horizontal lines that indicate possible support and resistance levels based on the Fibonacci sequence. The sequence starts with 0 and 1, and each subsequent number is the sum of the two preceding ones. In trading, the key Fibonacci ratios used are 23.6%, 38.2%, 50%, 61.8%, and 78.6%.
The Fibonacci Sequence
The Fibonacci sequence is a series of numbers where each number is the sum of the two preceding ones, such as 0, 1, 1, 2, 3, 5, 8, 13, 21, etc. These ratios derived from this sequence, especially the 61.8% ratio known as the "golden ratio," are crucial in predicting price movements.
Applying Fibonacci Retracements
To use Fibonacci Retracements, traders need to identify two significant points on a chart — a peak and a trough. The distance between these points is divided by the Fibonacci ratios to generate retracement levels. For example, if a stock rises from $100 to $150, the retracement levels are calculated as follows:
- 23.6% Retracement: $150 - (($150 - $100) * 0.236) = $138.20
- 38.2% Retracement: $150 - (($150 - $100) * 0.382) = $130.90
- 50% Retracement: $150 - (($150 - $100) * 0.500) = $125.00
- 61.8% Retracement: $150 - (($150 - $100) * 0.618) = $119.10
- 78.6% Retracement: $150 - (($150 - $100) * 0.786) = $110.70
These levels indicate potential support or resistance zones where the price might reverse.
How to Use Fibonacci Retracements in Trading
Identifying Trends
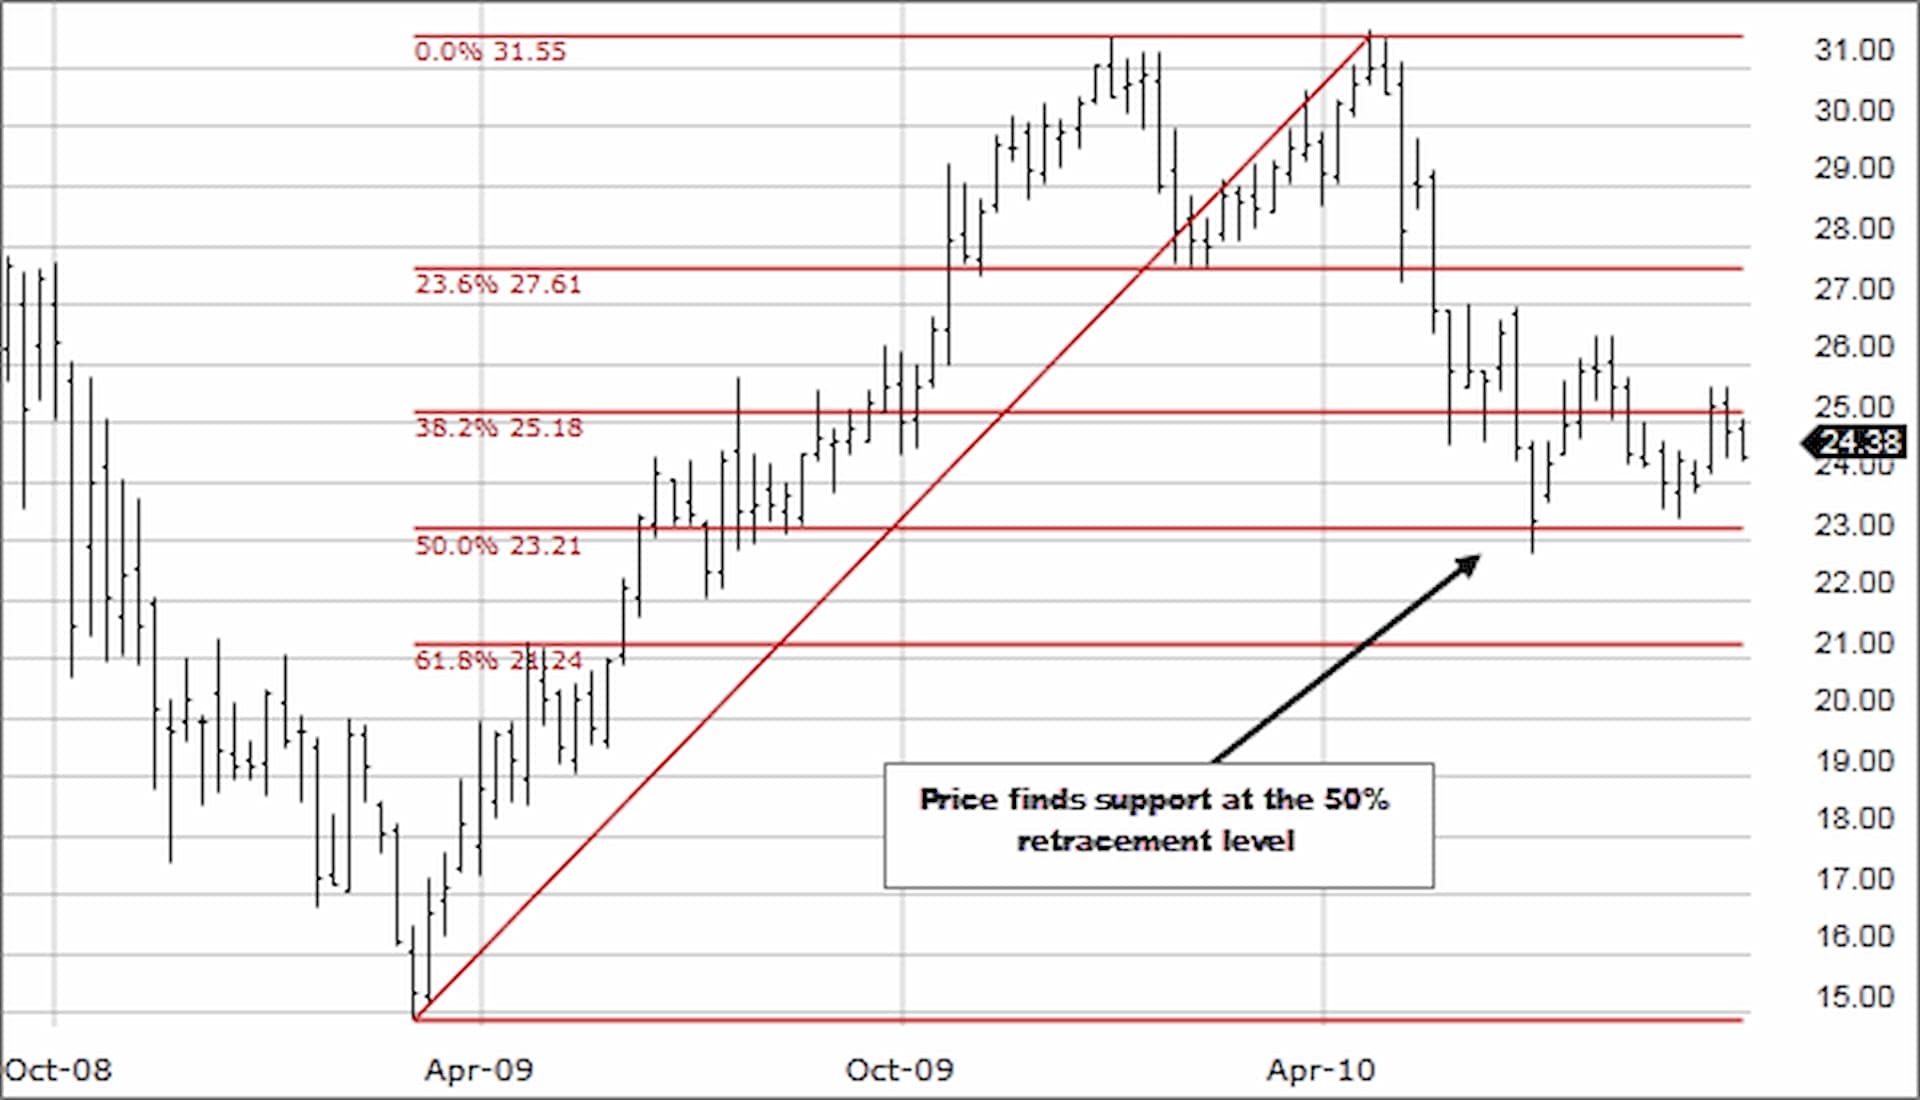
Fibonacci Retracements help traders identify potential reversal points in trends. By plotting these levels on a chart, traders can anticipate where the price might bounce or face resistance. For instance, in a strong uptrend, a pullback to the 38.2% or 50% level might present a buying opportunity as the price could resume its upward movement.
Example: If a stock experiences a pullback to the 50% retracement level during an uptrend, traders might view this as a potential entry point, anticipating that the price will bounce back and continue the upward trend. This strategy is often used in forex trading.
Setting Stop Loss and Take Profit
Fibonacci levels can be used to set stop-loss orders and determine take-profit targets. Placing a stop-loss slightly below a significant Fibonacci level can protect against adverse price movements, while take-profit orders can be placed at key Fibonacci levels to lock in gains.
Example: If you enter a trade at the 38.2% retracement level, you might set a stop loss just below the 50% level to minimize potential losses. Similarly, take-profit targets can be set at the 61.8% or 78.6% levels, depending on your risk tolerance and trading strategy.
Combining with Other Indicators
Fibonacci Retracements are more effective when used in conjunction with other technical indicators, such as the Relative Strength Index (RSI) or Moving Averages. This combined approach provides additional confirmation of potential reversal points.
Example: If the price retraces to the 61.8% Fibonacci level and the RSI indicates an oversold condition, this confluence of signals might suggest a higher probability of a reversal.
Common Mistakes with Fibonacci Retracements
Over-Reliance on Fibonacci Levels
Traders should avoid relying solely on Fibonacci levels for trading decisions. While these levels are useful, they should be part of a broader strategy that includes other technical and fundamental analyses.
Example: Using Fibonacci levels in isolation without considering overall market trends or economic news might lead to missed opportunities or incorrect trade decisions.
Misidentifying Extremes
Accurate identification of peaks and troughs is crucial for Fibonacci analysis. Misidentifying these points can result in erroneous retracement levels and misleading signals.
Example: Selecting a minor peak and trough instead of significant ones can lead to inaccurate Fibonacci levels, affecting the effectiveness of the retracement analysis.
Ignoring Market Context
Fibonacci levels should be interpreted within the broader market context. In strong trends, the price may not respect Fibonacci levels and could continue beyond typical retracement points.
Example: In a strong downtrend in stock trading, the price might only retrace to the 23.6% level before continuing lower. Relying on a deeper retracement level might result in missed opportunities or incorrect trade setups.
Conclusion
Fibonacci Retracements are a powerful tool for identifying potential support and resistance levels in the market. By understanding how to apply these levels and integrating them with other technical indicators, traders can enhance their trading strategies and improve decision-making. Remember to use Fibonacci Retracements as part of a comprehensive trading plan, considering market context and combining them with other analytical tools for optimal results.
TAGS
Latest Education Articles
Show more
Earnings Reports and Equity CFDs

Trend vs. Range Strategies

Trading Breakouts vs. Pullbacks

Hedging Basics for Intermediate Traders
Take your trading to the next level.
Join the broker built for global success in just 3 easy steps. A seamless experience built for traders who value speed and simplicity.

Create Your Account

Make Your First deposit
