How to Use Technical Indicators in Trading
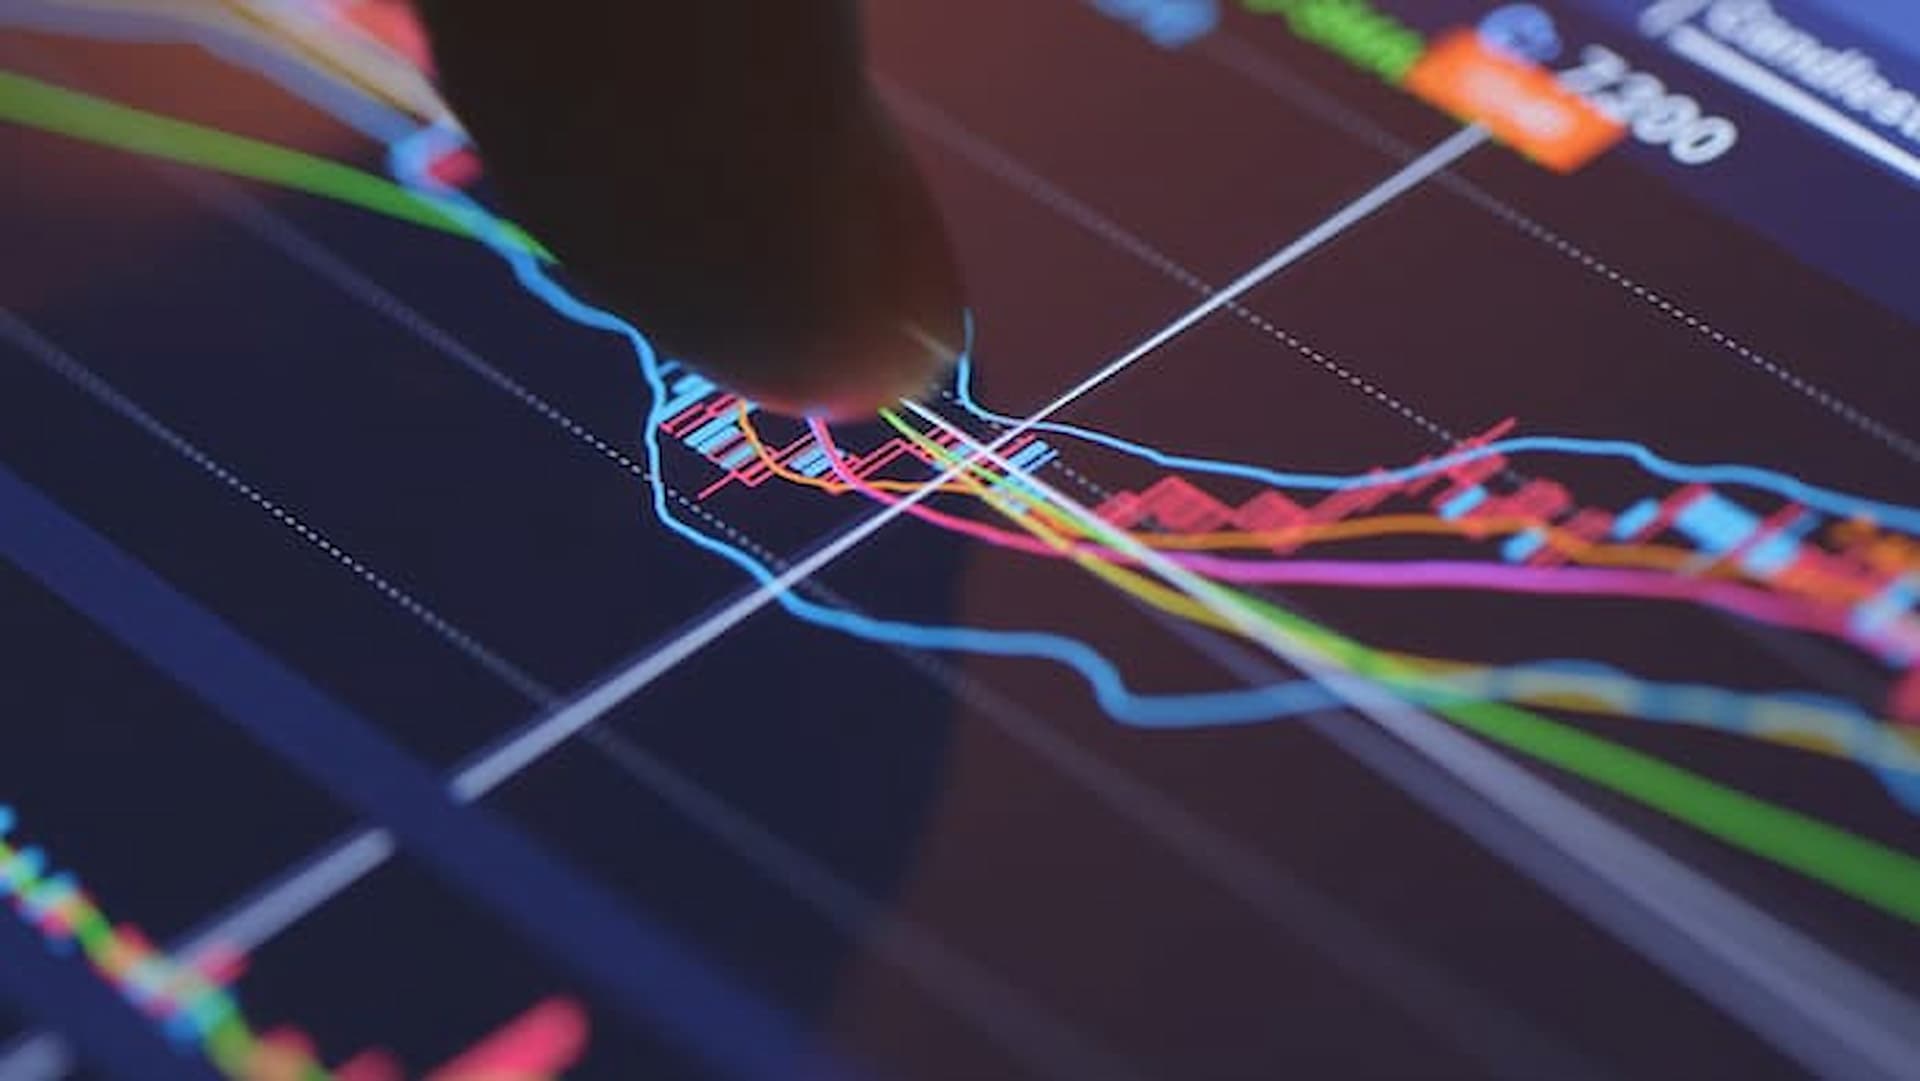
Technical indicators are powerful tools used by traders to analyze market trends, identify potential entry and exit points, and make informed trading decisions. Understanding how to effectively use technical indicators can enhance your trading strategies and improve your overall success in financial markets.

Learn how to use technical indicators to generate accurate trading signals for smarter decision-making in algorithmic trading. Discover trend-following, oscillator, and volume-based indicators, and how to combine them for precise entry and exit points. Enhance your trading strategies with tools, resources, and insights.
Technical indicators are mathematical calculations derived from historical price, volume, or open interest data. These indicators serve as valuable tools for traders, providing insights into market behavior. They assist traders in predicting future price movements, gauging market sentiment, and generating trading signals. By studying various technical indicators, traders can enhance their ability to interpret and apply these tools to their trading strategies.
Types of Technical Indicators
1. Trend-following Indicators
Trend-following indicators are designed to identify and follow the direction of the prevailing trend over a specific period. Common examples include Moving Averages (SMA, EMA) and the Average Directional Index (ADX). These indicators help traders determine the strength and direction of a trend, which is crucial for making informed decisions about entering or exiting positions. For a deeper dive into using moving averages and ADX for trend analysis, explore the comprehensive resources available.
2. Oscillators
Oscillators are a type of technical indicator used to identify overbought or oversold conditions and potential trend reversals. Examples include the Relative Strength Index (RSI) and the Stochastic Oscillator. These indicators are particularly useful for momentum analysis and market timing, helping traders pinpoint when a trend might reverse. To learn more about applying oscillator indicators in trading, consider studying the detailed materials provided.
3. Volume-based Indicators
Volume-based indicators analyze trading volume to confirm trends and assess market participation. Notable examples are the On-Balance Volume (OBV) and the Volume Weighted Average Price (VWAP). These indicators provide insights into the strength of a trend and the level of interest in a particular security. To understand how to use volume analysis for market insights, check out the comprehensive guides available.
Steps to Use Technical Indicators in Trading
1. Selecting the Right Indicators
When selecting indicators, it’s crucial to choose those that align with your trading style, time frame, and strategy objectives. Evaluating the strengths and limitations of each indicator in different market conditions is essential for optimizing your trading strategy. For more information on technical analysis tools and their applications, you can explore the tools and resources designed for traders.
2. Understanding Signals
Understanding how to interpret signals generated by indicators, such as crosses or divergences, is key to making actionable decisions. It’s also important to validate these signals using multiple indicators or complementary analysis techniques to ensure accuracy. Learn more about signal generation using technical indicators to enhance your market entry and exit points.
3. Combining Indicators
Combining different types of indicators can enhance signal accuracy and reduce the chances of false signals. By integrating indicators that complement each other, traders can confirm trends and strengthen their trading decisions. Explore multi-indicator strategies for comprehensive technical analysis to improve your trading insights.
4. Backtesting and Optimization
Backtesting trading strategies using historical data is crucial for assessing indicator performance and refining trading rules. Optimization involves adjusting indicator parameters and trading rules based on backtesting results to enhance strategy profitability. To learn more about backtesting tools and optimization techniques, review the available resources that can guide you through effective trading strategy development.
Practical Applications in Trading
1. Entry and Exit Points
Timing is everything in trading, and indicators can help you identify optimal entry and exit points based on trend signals and market conditions. Effective risk management includes setting stop-loss orders and profit targets based on these indicator signals. For a deeper understanding of trading platforms offering advanced charting tools and technical analysis capabilities, explore the platforms that cater to your needs.
2. Risk Management
Risk management is a vital part of any trading strategy. Indicators can help you gauge market volatility and adjust position sizes accordingly to control risk exposure. Using indicator signals to validate trading decisions also helps avoid impulsive actions driven by emotions. For more insights into risk management strategies using technical indicators, review the strategies and tools available for disciplined trading.
Conclusion
Mastering the use of technical indicators is essential for traders looking to analyze market trends, identify trading opportunities, and manage risk effectively. By understanding the types, interpretations, and practical applications of technical indicators, traders can enhance their trading strategies and make informed decisions in dynamic financial markets.

Article by:
Sofia De Luca
Education Center Specialist 24markets.com
TAGS
Latest Education Articles
Show moreTake your trading to the next level.
Join the broker built for global success in just 3 easy steps. A seamless experience built for traders who value speed and simplicity.

Create Your Account

Make Your First deposit


