
Advanced Chart Patterns: Head and Shoulders, Double Top/Bottom
Learn how to identify and trade advanced chart patterns like the Head and Shoulders and Double Top/Bottom for more effective technical analysis.


Advanced chart patterns, such as the Head and Shoulders and Double Top/Bottom, are powerful tools in technical analysis. These patterns can provide insights into potential market reversals and continuations, helping traders make more informed decisions.
Head and Shoulders Pattern
The Head and Shoulders pattern is a reliable reversal pattern that can signal a change in trend direction.
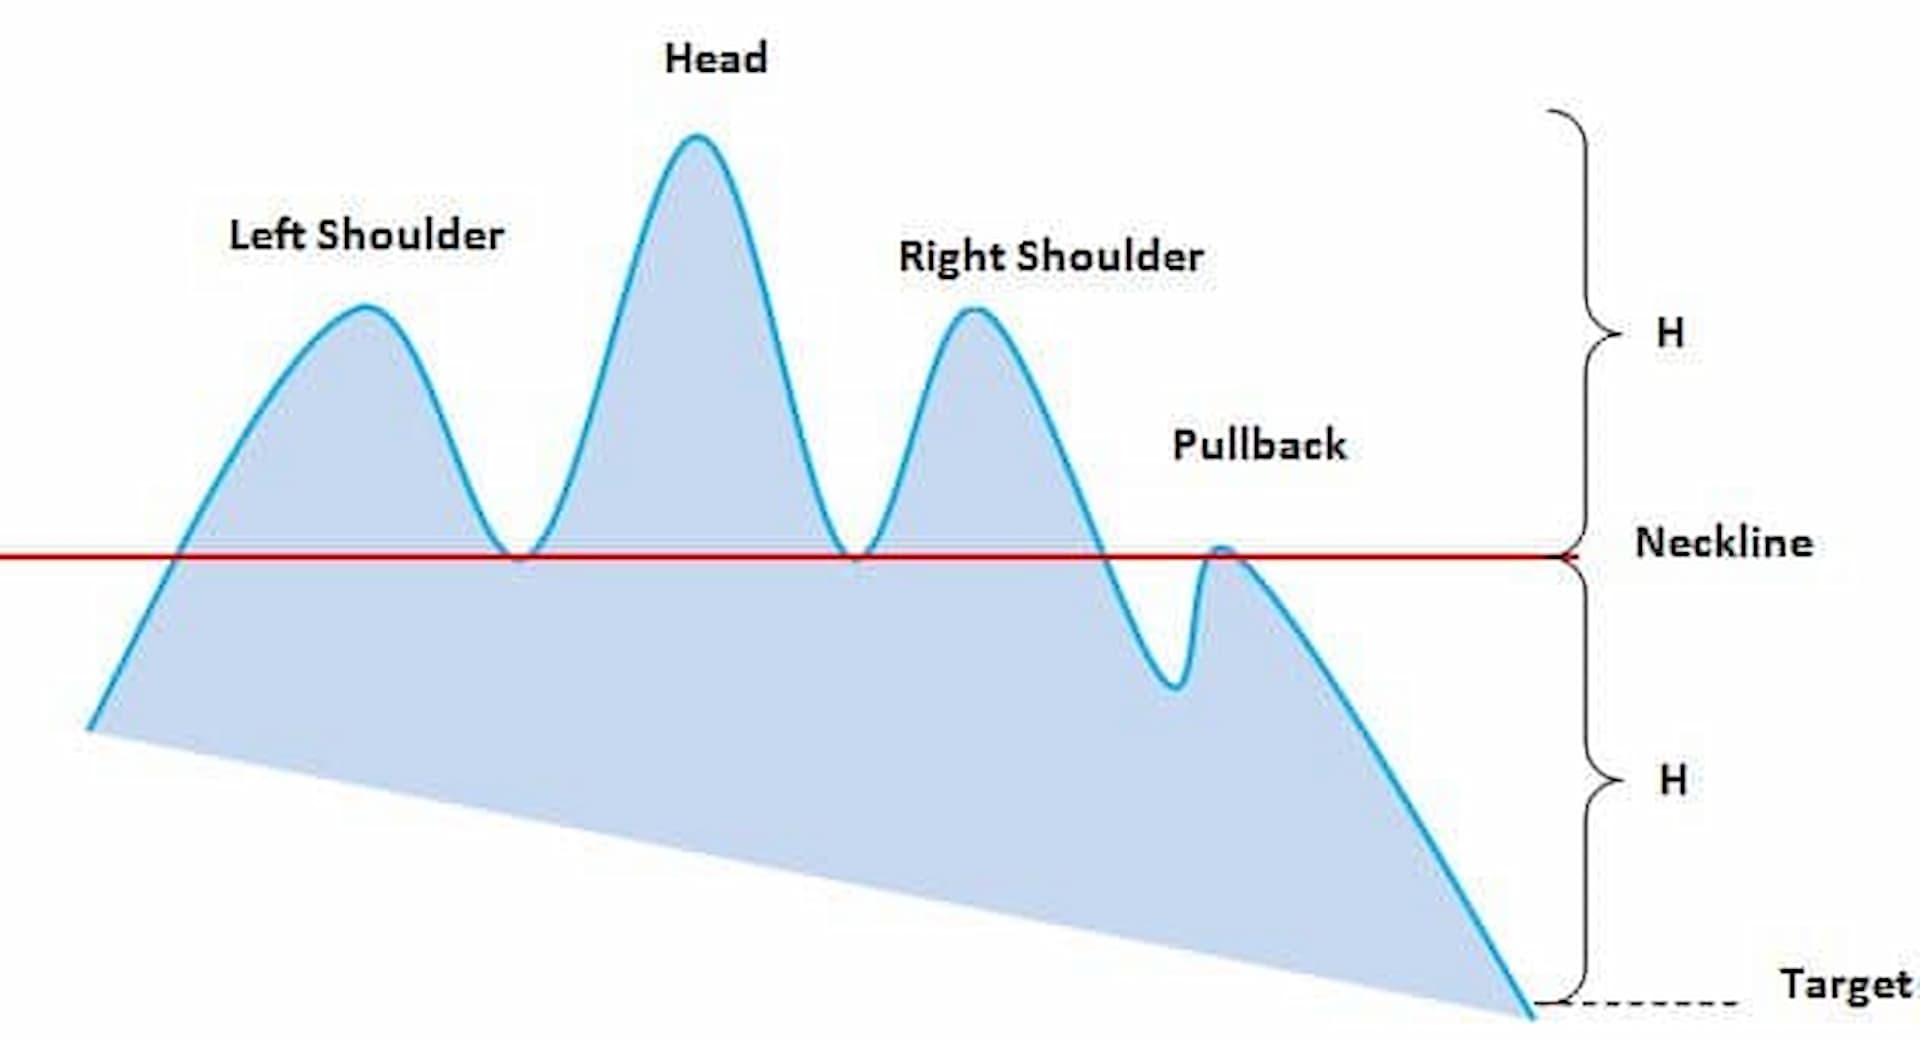
Characteristics of Head and Shoulders
- Left Shoulder: A peak followed by a decline.
- Head: A higher peak followed by a decline.
- Right Shoulder: A peak similar in height to the left shoulder followed by a decline.
- Neckline: A support level that connects the low points of the left shoulder and head.
How to Identify Head and Shoulders
- Formation: Look for the three peaks: left shoulder, head, and right shoulder.
- Volume: Volume often decreases during the formation of the pattern.
- Neckline Break: The pattern is confirmed when the price breaks below the neckline.
Trading the Head and Shoulders Pattern
- Entry Point: Enter a short position when the price breaks below the neckline.
- Stop Loss: Place a stop loss above the right shoulder.
- Target Price: Measure the distance from the head to the neckline and project it downward from the neckline break point.
For more detailed strategies on trading the Head and Shoulders pattern, visit 24markets.com.
Inverse Head and Shoulders Pattern
The Inverse Head and Shoulders pattern is the bullish counterpart of the Head and Shoulders, indicating a potential upward reversal.
Characteristics of Inverse Head and Shoulders
- Left Shoulder: A low followed by a rally.
- Head: A lower low followed by a rally.
- Right Shoulder: A low similar in depth to the left shoulder followed by a rally.
- Neckline: A resistance level that connects the high points of the left shoulder and head.
Trading the Inverse Head and Shoulders Pattern
- Entry Point: Enter a long position when the price breaks above the neckline.
- Stop Loss: Place a stop loss below the right shoulder.
- Target Price: Measure the distance from the head to the neckline and project it upward from the neckline break point.
Explore more on trading the Inverse Head and Shoulders pattern at 24markets.com.
Double Top Pattern
The Double Top pattern is a bearish reversal pattern that signals the end of an uptrend and the beginning of a downtrend.
Characteristics of Double Top
- Two Peaks: The pattern consists of two distinct peaks at roughly the same price level.
- Trough: A decline between the two peaks.
- Neckline: A support level at the low point between the two peaks.
How to Identify Double Top
- Formation: Look for two peaks of similar height.
- Volume: Volume tends to be higher on the first peak and lower on the second.
- Neckline Break: The pattern is confirmed when the price breaks below the neckline.
Trading the Double Top Pattern
- Entry Point: Enter a short position when the price breaks below the neckline.
- Stop Loss: Place a stop loss above the second peak.
- Target Price: Measure the height of the pattern and project it downward from the neckline break point.
For more details on trading the Double Top pattern, visit 24markets.com.
Double Bottom Pattern
The Double Bottom pattern is the bullish counterpart of the Double Top, indicating a potential upward reversal.
Characteristics of Double Bottom
- Two Troughs: The pattern consists of two distinct troughs at roughly the same price level.
- Peak: A rally between the two troughs.
- Neckline: A resistance level at the high point between the two troughs.
How to Identify Double Bottom
- Formation: Look for two troughs of similar depth.
- Volume: Volume tends to be higher on the first trough and lower on the second.
- Neckline Break: The pattern is confirmed when the price breaks above the neckline.
Trading the Double Bottom Pattern
- Entry Point: Enter a long position when the price breaks above the neckline.
- Stop Loss: Place a stop loss below the second trough.
- Target Price: Measure the height of the pattern and project it upward from the neckline break point.
Discover more on trading the Double Bottom pattern at 24markets.com.
Conclusion
Advanced chart patterns like the Head and Shoulders and Double Top/Bottom are essential tools for traders seeking to identify potential reversals. By understanding these patterns and how to trade them, you can enhance your technical analysis skills and improve your trading outcomes. Continuously refine your skills and stay informed with resources available at 24markets.com.

Article by:
Jeremy Noble
Education Center Specialist 24markets.com
TAGS
Latest Education Articles
Show more


Take your trading to the next level.
Join the broker built for global success in just 3 easy steps. A seamless experience built for traders who value speed and simplicity.

Create Your Account

Make Your First deposit
